My WordPress Blog is about neuroblastoma biology and Cancer Bioengineering Group
Tumour cells travel in a group to new destinations
The conference on models and tumour microenvironment has brought together International experts in this field. Two keynote speakers (Peter Friedl, Radboud UMC/MD Anderson and Andrew Ewald, John Hopkins University) presented exhaustive experimental data on plasticity and microenvironmental control of cancer invasion and metastasis.
Their research teams independently found that
Tumour cells migrate collectively as a team from a piece of tumour like a group of people who changed their minds and decided to travel by bus when the majority stayed camping. However, Andrew Ewald acknowledged that they are not pioneers in this discovery. In 1976 Liotta observed migration of tumour cells in a group of 6-10 cells.
A migration group of cells has their leaders who crave the path through surroundings to the new locations.
Leader cells depend on cancer types. It can be any tumour cell in some cancer types or a specialised one.
Migrating cells take shape and follow the pattern of tissues to be invaded.
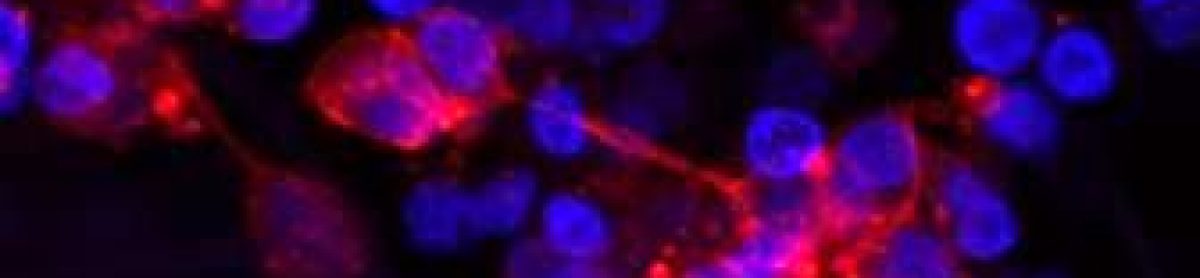
The experiments by Ewald’s research team on collective cell migration. In short, they co-implanted two lung tumour cell populations labelled differently into mice. One cell population had a green protein tag, another had red. After 6-8 weeks, researchers examined metastases and found that they had a mixed population of green and red tumour cells.
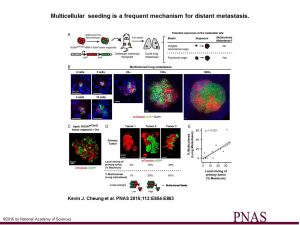
Multicellular seeding is a frequent mechanism for distant metastasis. (A) Schema of multicolor lineage tracing assay. ROSAmT/mG;MMTV-PyMT tumor organoids were treated with adenoviral Cre to induce recombination from membrane tdTomato (mTomato) to membrane eGFP (mGFP). Mosaic tumor organoids were then transplanted into nonfluorescent NSG host mice. After 6–8 wk, lungs of these mice were harvested. If metastases arise exclusively from single-cell seeding, there should be only single color metastases. In contrast, multicellular seeding should produce metastases with both colors. (B) Representative micrographs of polyclonal lung metastases of different sizes. n = 355 polyclonal metastases, across 16 mice and 4 independent experiments. (C) Representative micrograph of a mosaic tumor organoid treated with adeno-Cre and grown in 3D Matrigel with intermixing of red and green tumor cell clones. (D and E) Representative micrographs of primary tumors arising from mosaic tumor organoids transplanted into NSG host mice. Primary tumors varied in their local mixing of red and green tumor cell clones (local mixing %). These differences correlated with the percentage of multicolored metastases detected in the lung (% multicolored). n = 12 mice, 4 independent experiments, 4,072 metastases. Correlation determined by Spearman rank test for samples with more than five lung metastases per mouse. (Scale bars, 20 μm in B and C, and 2 mm in D.)